Scientific research has become almost religious and is seen by many as the gold standard for truth in modernity.
The allure of this credibility, objectivity, and authority that scientific studies give us makes them a very attractive target for manipulation.
In a world where several peer-reviewed studies can be easily collected to support both sides of any argument, it becomes crucial to tread carefully.

We must understand that even the most seemingly credible research may be tainted by biases, conflicts of interest, and intentional and unintentional misrepresentations.
We’ll discuss common flaws in study design and statistical analysis, as well as how to spot them!
Common Problems With Study Design
The two main places to look for manipulation like this are the design/funding of the study and the statistics with which the results are communicated.
One common tactic used to mislead people is cherry-picking data.
This involves selectively reporting only the data that supports a particular claim while ignoring or omitting contradictory evidence.
This can create a skewed perception of the benefits or risks associated with certain foods or diets, leading people to make uninformed decisions based on incomplete information (1).
In nutrition, industry-funded studies can introduce bias and influence research outcomes favoring a particular product or food group.
The financial interests of sponsors can influence study design, analysis, and especially publication, leading to a distorted view of the actual health effects of certain foods (2,3).
This is unbelievably common in modern research, and it doesn’t always show up because of crooked benefactors.
Many studies are not published if their findings contradict the opinions of the researchers or investors.
Potential Issues With Observational Epidemiology
Observational studies have long been a crucial part of collective knowledge about nutrition (4).
They are great for generating hypotheses, but it is impossible to draw causation from such studies for several reasons:
1. Confounding Variables
Observational studies cannot control for all variables, which leads to uncertainty regarding the cause of observed results.
Unaccounted confounders can lead to false associations between the exposure and the health outcome, creating misleading conclusions.
Healthy user bias and unhealthy user bias arise due to differences in the characteristics and behaviors of individuals who choose to participate in a study based on their health status or risk factors.

Healthy user bias, also known as the healthy user effect, occurs when individuals participating in a study are more health-conscious and engage in healthier behaviors than the general population.
These participants might be more likely to adhere to recommended diets, exercise regularly, avoid smoking, and seek preventive healthcare measures.
As a result, they tend to have lower rates of certain health conditions or diseases compared to the general population.
The presence of healthy user bias can lead to overestimating the benefits of specific interventions or lifestyle factors.
For example, in a study evaluating the association between eating vegetables and cardiovascular disease, participants who eat more vegetables might also be more likely to exercise, giving the impression that the diet is more effective than it is.
Unhealthy user bias, also known as the sick user effect, is the opposite of healthy user bias.
It occurs when individuals who participate in a study have higher disease burdens or engage in riskier behaviors than the general population.
These participants might be heavy drinkers and smokers, seek medical attention more frequently, be prescribed more medications, or have higher rates of pre-existing health conditions.
Unhealthy user bias can lead to an overestimation of the harms or risks associated with certain exposures or interventions.
For instance, in a study examining the association between red meat consumption and cardiovascular illness, participants who eat more red meat might also be more likely to smoke and drink, making red meat appear more dangerous than it actually is for the general population (5).
2. Reverse Causation
Observational studies cannot determine causality definitively.
The observed association between an exposure and an outcome may be due to reverse causation, where the “outcome” influences the “exposure” rather than the other way around.
This can lead to erroneous conclusions about the direction of the relationship (6).

For example, red meat is often vilified because it supplies nutrients that can contribute to the production of TMAO (trimethylamine N-oxide).
TMAO has been associated with diabetes by observational studies, so many researchers conclude that red meat should be avoided to prevent increased TMAO production.
The waters are muddied by the fact that fish also supplies fully synthesized TMAO at much higher rates and has not been associated with the same diseases.
This is explained by the fact that insulin upregulates TMAO production, so diabetes causes increased TMAO, not the other way around (7).
3. Selection Bias
In observational studies, selection bias typically occurs when the researchers choose participants or participants self-select to be part of the study.
Those who choose to participate might differ from the general population, leading to results that are not representative.
For example, people who are proud of their efforts to maintain good health might be more likely to enroll in a study about health, potentially contributing to healthy user bias (8).
4. Recall Bias
In studies that rely on self-reported data, such as food diaries or lifestyle questionnaires, participants may have difficulty accurately recalling past exposures or habits, leading to recall bias.

People also tend to conceal habits of which they are ashamed of, even when asked by strangers in a clinical setting (9).
For example, it has been calculated that caloric intake reports from most respondents (67.3% of women and 58.7% of men) across the entire history of the National Health and Nutrition Examination Survey were not physiologically plausible (10).
Respondents both underestimated and overestimated their reported energy intake.
Jeff Nobbs has compiled an incredible summary of this hopeless situation (11).
He writes:
“A 2015 paper in the International Journal of Obesity writes that self-reported data on diet are so poor that “they no longer have a justifiable place in scientific research.”
In a 2017 analysis of 156 biomedical association studies reported by newspapers, only 48% of the studies were in any way validated by follow-up studies.
To put it another way, according to Vox, “half of the studies you read about in the news are wrong.”
A 2011 paper in the Journal of the Royal Statistical Society puts it bluntly, “Any claim coming from an observational study is most likely to be wrong.”
The main takeaway is that observational or epidemiological studies should be approached with extreme caution.
A Quick Note on Meta-Analyses & Reviews
Meta-analyses and systematic reviews compile data from multiple studies.
They are often regarded as better resources than primary research because they take more information into account, but they should be scrutinized just like other studies (12).
The sources analyzed in a meta-analysis are subject to the same pitfalls as all other primary sources.
Additionally, cherry-picking is common when compiling these reviews, and it becomes easy to create the illusion that all evidence suggests one idea when there is more variety in reality (13).
Misleading Statistics
Statistical information can also be misleading in a variety of ways. These include:
1. Graphs and Figures
Because visual representations of data – such as graphs and charts – are created from scratch after data has been collected, they are almost inherently biased in their presentation.
Distorted scales, manipulated axes, or omitted crucial data points (often dismissed as outliers) are tactics used to misrepresent statistical information effectively and can easily happen unintentionally.
For example, a graph comparing the sugar content of two beverages might use a truncated y-axis, making the difference between the two products appear more significant than it is.
Conversely, a y-axis with an overly large range could make a sizable practical difference appear very small.
The following charts show the exact same information:
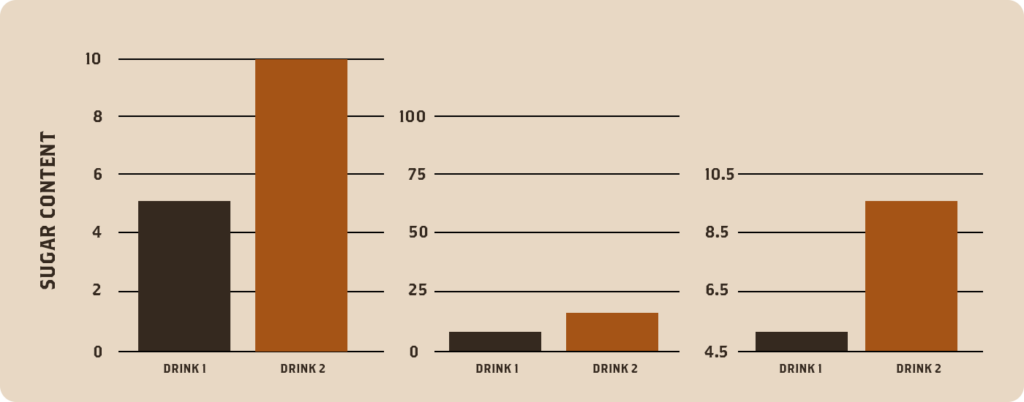
A reader should approach data visualizations with care.
2. Variance and Standard Deviation
Variance and standard deviation describe the spread or dispersion of data points around the mean.
These statistics can be misused to obscure the significance of differences or similarities between groups.
For instance, if a study reports very high variance or standard deviation, it can imply that the data points are highly scattered, making it difficult to discern meaningful patterns or differences.
This can lead to the misinterpretation that there is no clear relationship between variables when, in reality, there might be a strong relationship masked by the variability.
On the other hand, intentionally omitting information about variance or standard deviation can also mislead people by presenting results as more consistent or significant than they are.
3. Covariance and Correlation
Covariance and correlation are measures of the relationship between two variables.
Misleading interpretations can arise when assuming causation from correlation or neglecting other relevant variables.
When two variables are correlated, they tend to vary together, but it does not necessarily mean that one causes the other.
A well-known (and nutrition-related) example of this fallacy is the strong correlation between cheese consumption and deaths by entanglement in bedsheets.
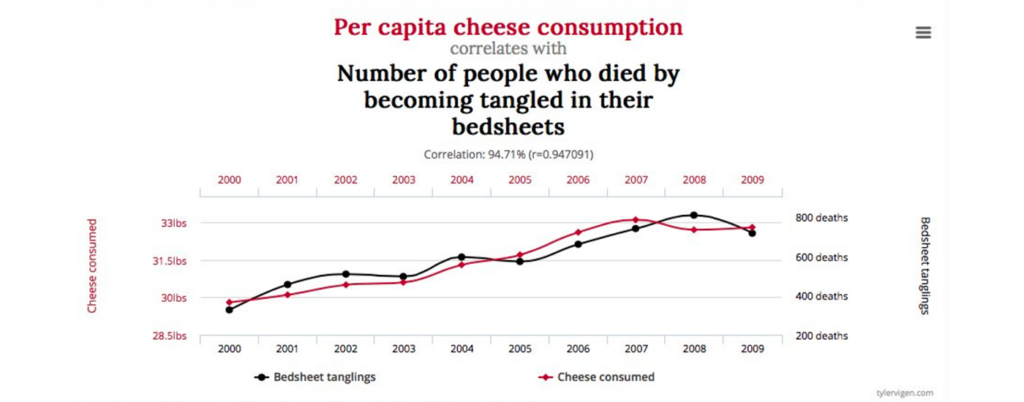
Clearly, neither of these events is causing the other.
Still, their correlation coefficient (r=0.947) is high enough that, if observed between a nutritional intervention and a health outcome, it would likely be deemed meaningful (14,15).
4. Relative Risk and Absolute Risk Difference
Relative risk is a measure used in epidemiology to assess the risk of an event or outcome in one group compared to another.
Presenting it without considering the absolute risk can lead to misleading conclusions (16).
A slight relative risk difference might be deemed significant, but the actual increase in risk might be negligible when considering the baseline risk.
By highlighting relative risk alone, the absolute magnitude of the effect might be overlooked, leading to an inflated perception of its importance.
For example, if you had 100 people on stroke medication and 1 had a stroke, this corresponds to a 1% risk of stroke. If you also had 100 people not on the drug and 2 had a stroke, this corresponds to a 2% risk of stroke.
Relative risk is calculated by comparing the 1% and 2% and concluding that “people not taking the medication are twice as likely to have a stroke” or “this drug reduces your chances of having a stroke by 50%”.
This may be true, but it’s also possible that the drug is not as effective as it sounds.
5. Hazard Ratio
The hazard ratio is a measure commonly used in medical research to compare the risk of an event occurring between two groups.
Misleading interpretations might present hazard ratios without actual survival rates or time scales.
A hazard ratio alone does not indicate the overall survival rates in the studied groups or the absolute impact of the treatment.
Consequently, conclusions based solely on hazard ratios might overstate the benefits of a particular treatment or intervention without providing a complete picture of its efficacy (17).
6. Exaggeration of Small Effects
Nutrition studies often deal with complex and multifaceted interactions within the human body.
Consequently, many findings show small effects that may not be practically significant.
However, statistics can be used to exaggerate these minor effects and present them as groundbreaking discoveries (18).
While a statistically significant result indicates that an association likely exists, it does not necessarily mean that the effect is substantial or clinically relevant.
High statistical significance indicates that the effect likely exists, not that the effect is large.
A study might report a tiny reduction in disease risk associated with a specific dietary component but without placing it in perspective with other risk factors or considering the practical implications of the effect.
7. P Values and the Null Ritual
The Null Ritual is perhaps the most misused tool in statistics, and it is especially pitfall-ridden for the reader because its results are almost always misinterpreted, whether in good faith or bad (19).
It compares data from a control group with data from a treatment group, establishing some probability of obtaining the treatment results purely due to chance.
A low P Value provides commentary on the statistical significance of the data, but it says nothing about the probability of any theory itself.
Even statistics experts rarely remember this fact (20).
Many researchers treat statistical significance as an all-or-nothing concept.
Researchers often aim to reject the null hypothesis (i.e., assume there is a significant effect from the treatment) and accept the alternative hypothesis solely based on a specific p-value threshold (21).
This approach oversimplifies the statistical analysis, ignoring the uncertainty and variability inherent in research data (22).
Furthermore, researchers sometimes perform multiple statistical tests without adjusting for the increased risk of obtaining false-positive results.
This “p-hacking” involves testing multiple hypotheses until a significant result is found, leading to a higher likelihood of erroneously declaring a significant effect (23).
For example, if an unscrupulous researcher wanted to establish a connection between vegetable consumption and not losing hair, they would:
- Gather a group of 20,000 people to report on their consumption of kale, celery, lettuce, arugula, etc.
- Run every test under the sun: Do people who eat only kale keep their hair longer? Do young men who eat both kale and lettuce but not arugula go bald on top more often than those who also eat arugula? Do older unmarried women who don’t exercise and eat none have a higher incidence of baldness?
If enough of these significance tests are run, it’s likely that a low p-value will be found for one of them.
The wording of this test could then be twisted to express the idea that vegetables help prevent hair loss.
Even if a study reports a low p-value in good faith without “hacking,” the language surrounding this result should be scrutinized. A p-value is a probability that measures the strength of the evidence against the null hypothesis.
However, it does not provide information about the effect size, the practical significance of the results, or the probability of the hypothesis being true (24). The effect itself might be negligible or practically irrelevant.
Conversely, a non-significant p-value does not necessarily imply no effect; it might indicate insufficient sample size or high variability in the data (25).
Most Studies Warrant a Closer Look
The intention here is not to discourage the use of scientific research in forming opinions but instead to call attention to the importance of scrutiny towards it.
Anecdotes are looked down upon as baseless, biased, and meaningless in medical/health-related circles, and perhaps this is often true.
Still, academic studies are subject to many of the same pitfalls.
The illusion that the “science is settled” regarding health or nutrition is profoundly shortsighted.
Directly contradicting research is available to support both sides of practically every contentious health debate, which is why the arguments are perpetual.
Anecdotal evidence and traditional wisdom can hold significant value in a situation like this.
Since scientific evidence is often limited, contradictory, or evolving, personal experiences can provide valuable insights and context.
Additionally, anecdotal evidence and ancestral precedence can serve as a valuable starting point for researchers, helping them generate hypotheses and design more targeted studies.
Embracing anecdotal evidence with caution can complement scientific research and provide a more holistic perspective on health-related matters, particularly in areas where conclusive evidence is yet to be established.
Subscribe to future articles like this: